Friday, 10 April 2015

What makes a good trade?

This is a topic that has been covered many times by many people, and a question that I am sure most readers already know the answer to.

Over the past few weeks the market has been rather tough and trading strategies and plans were thoroughly tested. Therefore this whole 'discipline' thing has been at the forefront of my mind for some time now. Few things in life are as difficult as sticking to your own rules, hence all this blabbering about sticking to your plan and so on.

To keep this interesting and counter intuitive, I'll start with all the things that a good trade is not.

A good trade is not:
A trade which made a lot of money
A trade that had a great risk:reward ratio
A perfectly timed entry, at the bottom, just before the bounce
A trade which everyone told you wouldn't work, but does, beautifully
A trade in which you captured a huge move in the share price

Sure, the above list are all things that are awesome, right? ... Wrong. Every single one if those can be put down to blind luck. Even if all of these characteristics and more are all present in the same trade, it could still not be a good trade.

So what is a good trade then, if not one that you made money on? Very simply put, a good trade is a trade that was executed exactly according to how it was planned, regardless of the outcome. By this definition a good trade could be a losing trade as well. As long as the trade was executed in accordance with how it was planned, that is all that is important.

Now I'm not saying that you shouldn't close your trade because it missed your target price by 1c. I'm saying that if you have a clearly defined plan with clear if/then rules, and you stuck to that plan, it was a good trade. Regardless of whether it was a winning or losing trade.

You see the problem is that most traders act - or trade - randomly. They take trades that are suggested to them, they don't follow money management rules and they have no clear set of criteria that define an opportunity to them. Yes, the market can and probably will reward these traders a few times for their random behavior, although over time their inconsistency will cost them dearly.

What is most important to create consistency out of chaos is to take just one good trade. Then another. Then another. Then another.

Your homework is to read; One good trade - Mike Bellafiore and, Trading in the zone - Mark Douglas.

Happy trading.

@TraderPetri
17 March 2015

The plan is to have a plan

I should rather say, the importance of having a plan that you believe in.
This is a difficult concept to get across, maybe because I am merely a student and this is one of the concepts I am struggling with, but putting it on paper had proved to be rather more challenging than what I thought it would be.
Some traders have no plan at all. Which is fine if you've been trading for 20 years and you can react to the market correctly in its infinitely various conditions. These traders are the rarest of the lot and are easily the most profitable. Did I mention that they're very few and very far between? For the most part, traders without a plan - which I am sure number in the thousands - are chewed up and spat out by the market as they endlessly engage in random decision making and never understand why they keep getting random results.
Then there is the trader who has a great plan... until they have a losing trade, at which point they get another great plan. The plan is constantly changing from one trade to the next. The plan changes half way through a trade. There is simply no discipline to stick to the rules that were created. I'm sure you can imagine how the market rewards this trader. Chewing. And spitting.
The problem here is that the trader does not believe in their plan.
So let's look at what a good plan should be. Well, good to start off with :P
1) It needs to be defined. So it needs clear entry and exit criteria along with 'if/then' scenarios. For example; what are the things (or factors) that can or should make you close a trade early? It needs to be defined. And on paper.
2) It needs to be back tested. There is no magic formula that will work forever, that much we know. There is however, a great amount of comfort that comes from spending the time, doing the maths and running the scenarios to see if your account will survive the crash if you stick to your plan. This will not only indicate if your brilliant new plan is in fact brilliant or not, but will also help you have the faith in it required to stick to it.
And that's it really. If you come up with something that suits your personality, aka you are comfortable with. Then all that is left to do is for you to question your sanity as the market rigorously tests your resolve to stick to your plan.
@TraderPetri
5 March 2015

Thursday, 12 March 2015

I don’t chase trades, but sometimes I should

Another trade, another lesson learned.

Again, the best way to explain is by means of telling the story as it happened. Thursday morning 12 Feb 2015 Woolies (WHL) released their Unaudited Results on SENS. I won’t go into too much detail, so long story short, the results looked very good. This now gave me a few good reasons to buy the stock. Firstly there was the price formation on the chart. It had come down nicely and had been testing support for a few days. It hadn’t given a buy signal yet, but you could get the sense that the buy signal was coming. Secondly and according to the results that were released before the market opened, they’d done a good job with their Australian acquisition and revenue was looking to steadily increase in the years to come. So the time had come to pull the trigger.

During the opening auction, I bid for stock slightly higher than the previous day’s close (Wednesday). The stock came out of auction a lot higher than the previous day’s close and after some slight indecision, shot up the page and started a fierce rally. I didn’t move my bid. I don’t chase trades. I’d figured that the market always gives a second chance, which it does… most of the time. In this case though, I was resolute that I would stick to the rules and not chase. I was adamant that I would get my second chance. I didn’t.

Friday morning came, and in accordance with my rules, I bid for the stock again. Again it opened higher, had a brief moment of hesitation (offering me a chance to lift the stock), and again I didn’t move my bid higher, and again the stock shot up the page.
I had missed a R10 move on a R80 stock. That is a huge move!
So what did I learn? Well, first I should give credit to the person who taught me the lesson, for this one I didn’t figure out myself, but rather had it pointed out to me. @Trader1137 on twitter said this to me:

Trader1137 @Trader1137 -@TraderPetri I have a simple plan. If the share is up on the day ... take the offer. If the change on the day is minus, sit on the bid.

What hurts the most here is that on Friday I had the opportunity to do just that, but apparently I am a slow and stubborn learner.
It is fairly obvious if you think about it, although I never really have. Granted that although the circumstances in which this would be applicable are rarely prevalent, they will from time to time crop up. And thus, my lesson for the past week is that sometimes you have to chase the winner, just a little bit.

@TraderPetri
13 Feb 2015

Friday, 27 February 2015

Having a bias... it's dangerous stuff

The market can be very unforgiving at times. Well, not just at times, always. If you make a mistake, it will not hesitate to take your money. What follows is my realisation of how I made a fairly large mistake over the recent weeks.

It all started with the falling oil price. Sasol kept trading lower. I recognised a trend and took a short at R545.00, which I covered at R520.00. Job well done, except that it kept falling. Agony. After a brief attempt at a long, which burned me, I shorted it again at around R389.00, which again I profited on as I closed that one at R372.00. The stars were aligned, Oil was tanking, there was no hope, Sasol was going to R300.00... at least that is what my brain was saying. Naturally, as soon as it bounced (which I caught actually), I shorted again. This time at R382.50-ish.

Now ok, maybe some background is needed here. At the time I was watching the Oil price like a hawk and saw that it just could not get above $50 a barrel (Brent Crude) and figured that as long as it stays below $50, Sasol is dead in the water. I saw a lot of resistance at $50 as it kept trying to get above that level but could not manage to do it. My Sasol short started running against me, almost instantly actually, yet I remained convinced that it would tank because oil was going to $35 (in my mind that was obvious). I shorted more Sasol at R408.00. 

What I didn't realise I was doing, was ignoring all the signs that the Oil price could turn - the most obvious being that Shale Gas projects were being put on hold or cancelled completely by many oil companies – and focusing on only those factors that confirmed my view that Oil, and Sasol, was dead. I had built up an internal bias and didn’t want to accept any other reality other than the one I had created in my own head. Another dead giveaway was that the volumes on Oil was picking up in a big, big way as it kept assaulting $50.

At this point I should say that I am very grateful that I had put ‘a daily close on the Oil price above $50’ as my stop loss for the Sasol short, because one fine Friday night, news broke that 93 oil rigs were canned and oil shot up 7% to close at $52.99. Monday morning came and I came out the gates storming! Buying Sasol like a mad man. Eventually I covered my entire short at an average price of R434.36. The whole exercise had destroyed just under 2.5% of capital.

So what went wrong? Well, I had felt that I had missed out on the short of the century. One that I called, but never really traded as I should have. Taking small profits here and there but not really milking it as I so clearly could have. Then when the picture started changing and the ‘green shoots’ started showing, at the very depths of my subconscious, I was blocking these signs to confirm my own view.

In retrospect this is all fairly obvious, but at the time it is incredibly difficult to recognise. Next time I will more vigilant though. Some lessons are hard on you, but all of them are necessary. Managing these internal biases is definitely one of the things that goes on my list of things to improve on.

@TraderPetri
4 February 2015

Sunday, 8 February 2015

Wednesday, 19 November 2014

Trying to learn from my mistakes

Mmmm, where do I begin? I've not been blogging for a while, so getting this out is a little more difficult than what I remember.

I'm sure we all remember the recent market correction? The one that we, technically, haven't yet come out of? Yes, that 12.3% pullback on the Allshare Index that undoubtedly rattled the cages of the over-geared and under-prepared. How many casualties that correction claimed, I do not know. What I do know though it that the way I played it, was completely wrong.

To be honest, I saw it coming. A mile away. Although I did nothing and watched the slow-motion train wreck with pain filled eyes and a very frayed feeling soul. I was stressed. I saw the daily ALSI chart close below the medium term trend line. The channel that the ALSI had been trading in since the bottoming out of the previous crash, had just been broken. I knew I had to short it. I knew I had to hedge my longs. I knew there was a unique opportunity to make money. I did nothing.

Fair enough, for the long term equity investor, staying long is exactly what you do, always. But for the short term trader/weird-trading-portfolio-builder-and-trader-hybrid-whatever-I-am-thingy, staying long is not always the best option. Granted, the strategy that I use to trade (not as much a strategy as a conceptual framework within which I trade) is one that favours being long over short, but that does not mean that I can justify not taking the short when it was so obviously clear. So why didn't I take the short?

This is where the tricky part comes in. I didn't take the short because I was already long, too long. My rules are simple, DO NOT GEAR AT THE TOP OF THE MARKET. Simple.
I had geared at the top of the market. Not much, mind you, but enough. I was geared 1.6x when the trend line broke. Why was I geared 1.6x times when I was, according to my rules, not supposed to be? Simply put; I was on a winning streak, overconfident and greedy. So there I was, looking at the clearest short in years and my internal bias refuses to let me acknowledge what I am looking at. Mistake number 1.

The next phase I did rather well, I think, to stick to the game plan. Buy into weakness, allow the market to fall, gear into the correction. Don't get scared. The market fell and I stuck to the plan, calm as calm as calm can be. Soon enough though, the gearing gauge clocked 3x (if you remember I was over-geared to start off with) and the market hadn't come down enough to warrant 3x. My colleagues had pale faces, their stress heightened mine (because saying that I wasn't stressed would be not just a lie, but a bad one too), we worked each other up... thoughts turned to the worst case scenario. The idea of cutting it all, taking the punch on the chin and going to cash was toyed with, discussed, considered. I banked my first losing trade at the very bottom. Mistake number 2.

Now at this point you should notice that if it weren't for mistake number 1, mistake number 2 would have been more easily avoided. Alas, it was for mistake number 2.

Eventually, as indicated by the height of my panic, the market had started to bounce, and by this time, seeing as I had now taken the view that I need to get out, I refused to believe that it was actually going to bounce all the way up. I saw the bounce as a bear trap, a fools rally, I sold into it. Some trades I banked at losses, some I broke even on, some I actually made a profit on. The accounts recovered to the High Watermarks, a little above in fact, and I took the opportunity to get out of, in hindsight, all the winners. I went to cash, wiped my brow and felt grateful that I got out without losing a cent. 

Had I stuck to my rules, I'd still be in the likes of WHL, CML, SHF and PSG... and more. The accounts would have been much, much higher above their High Watermarks. 

I think the real lesson here for me is that; all the mistakes I have made over the last 2 months stemmed from just one, lack of discipline. I got cocky and thought that this was easy. It cost me. Now though, I need to be careful to not be too hard on myself and keep reeling in the pain of leaving money on the table due to poor trading. The market moves on, and I must move with it. Except now I need to stick to my rules. A difficult as they can be to adhere to, I need to stick to my rules.


Saturday, 28 June 2014

Tulips, Bitcoins and Naspers

Well alright, they have nothing in common at all. Except one thing... parabolic charts. Now this is not meant to scare anyone, or predict the future, or to poorly attempt to look like a guru. This is purely an observation and some thoughts that have been rattling around my head.

First, lets look at the past. We start with Tulips. I am sure everyone knows the story of Tulip Mania, so I will not go into detail regarding what happened.

This chart shows what happened to the price of Tulips between 1634 and 1637. That a long, long time ago, although it forms the basis of my observation. It can be seen a a prime example of human nature perhaps, the tendency for people to go a little crazy at times when greed and fear start taking over. Clearly this was a bubble that formed from the euphoria that reigned at the time, and inevitably popped when people realised 'hey, these are just flowers..'. 

The next example of a bubble is the South Sea Company bubble that formed and popped between 1719 and 1722. Again euphoria took hold and again it ended badly.

These are more recent examples that show the Nikkei, the Nasdaq and the DOW during the .com bubble. Again people became euphoric about something and later realised 'hey, these are just websites...', which inevitably lead to the popping of the bubble.

Alright so now we have a few historic examples of how these things have played out in the past. Let's look at the psychology behind these bubbles. 

This chart does well to indicate the different states that people are in when these bubbles form and inevitably pop. It is important for us, here, to take note of the Blow off Phase and the Bull Trap and Return to 'normal' stages. 

Now let's look at Bitcoin's chart. 

The first chart looks are Bitcoins versus the .com bubble. The similarity in the charts should be evident.


These two charts compare the typical bubble chart to the Bitcoin chart. Once again, the correlation here should be clear.

This chart shows the most recent picture we have of Bitcoin. It looks to me as if we are re-entering the Awareness Phase. We know these patterns of human behavior repeat themselves and thus can assume that Bitcoin will in due course push for another high. Time will tell how long it takes to go parabolic again, if at all. 

I say 'patterns of human behavior', because that's all the stock market really is, isn't it? A place where humans interact with each other and allow their primal emotions to rule their actions. There is no such thing as a rational investor and ultimately sentiment drives markets. Anyway, I digress.

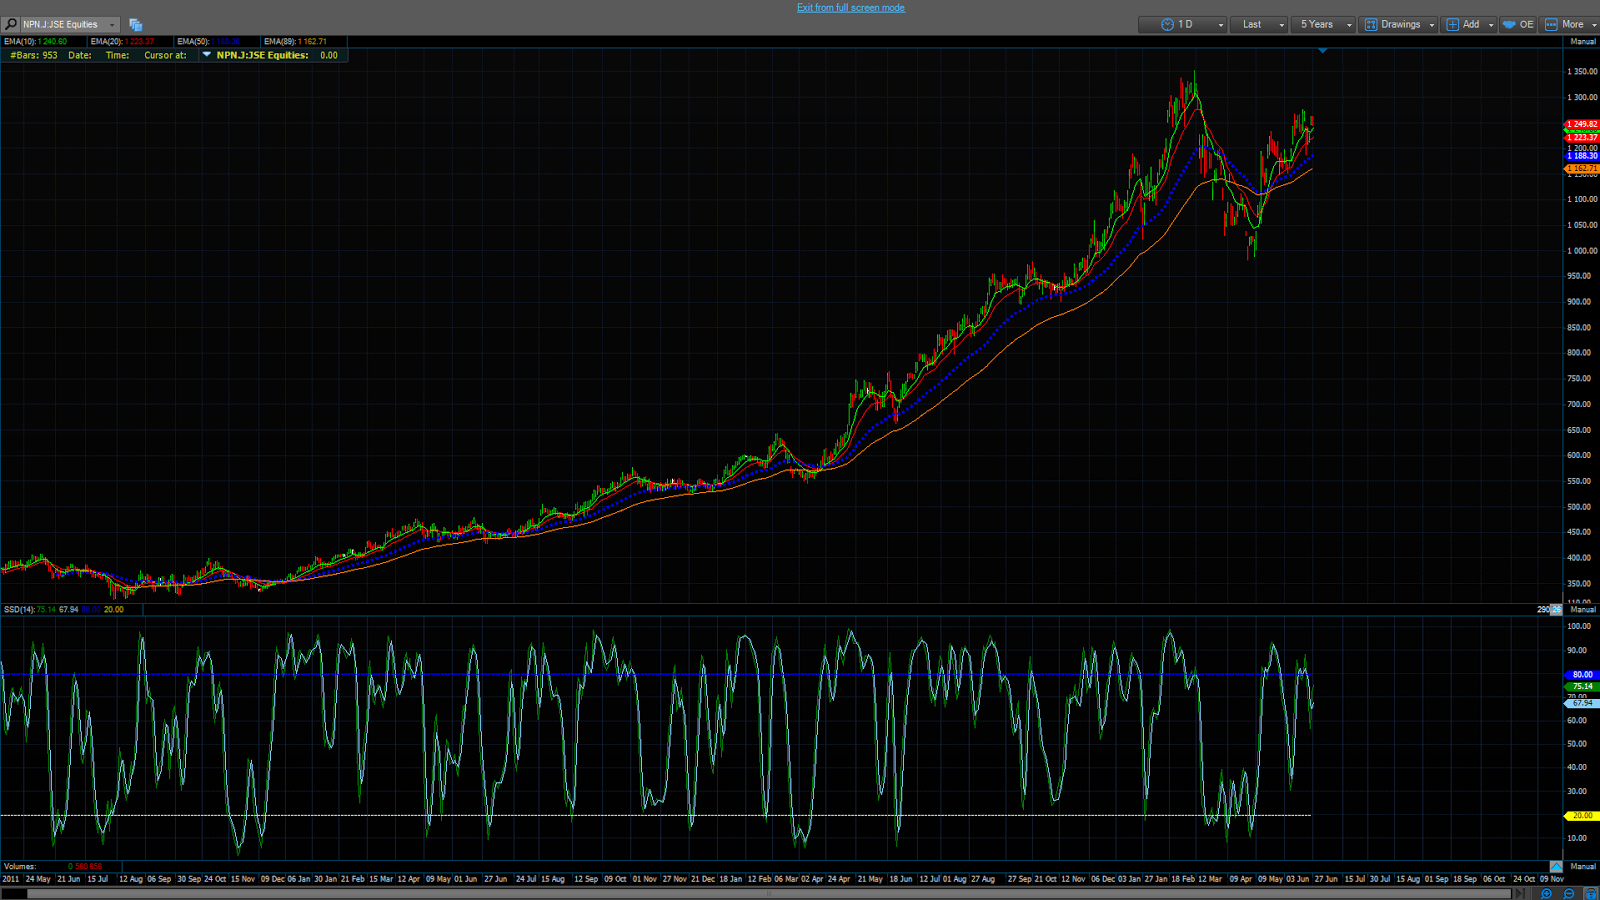
Now let's look at the Naspers chart.

Look familiar? Sure it does. To me anyway. This chart is from 2011 to 27 June 2014, roughly the same period of time as the examples from 1634 and 1719. It also looks like we are in the 'Return to normal' stage doesn't it?

There are no shortage of Naspers bears, or bulls for that matter. I am not saying that this is the beginning of the end either. I am just saying that it all looks terribly similar. 

Opinions, thoughts and comments are welcomed! Please leave a comment below if you would like to add anything.

>Peace and love